Wednesday, February 28, 2007

No JOYG in Mudville

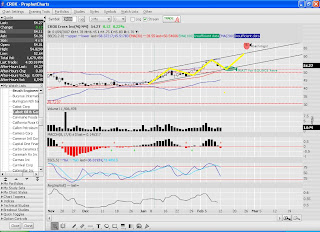
Well Traders, a few days ago I mentioned JOYG had made a significant breakout. On that breakout I eased into a small position waiting on the follow-up. On Monday, I sold some March $55 Covered Calls for $2.00/share which I thought was a GREAT amount of money for so little time left. You'll see that the Implied Volatility was heading up making options contracts worth some pretty good money. This also allowed me to "hedge" against a falloff if earnings went sour. Well, after yesterday's mess, JOYG earnings were also a mess so this stock TANKED by over 20% in 2 days. WOW! Look at the chart above, it's like someone jumped out a window.

Yes, I did get taken out by my stop loss (smart Risk Management), lower than I wanted to because of the $3+ gap open, but there was nothing I could do about that. The Covered Call which I bought back today for $0.15 returned 1,233% in 2 days ($1.85 "profit"/$0.15 "cost"). Of course, this only happened because the stock tanked. Still, by easing into a small position while waiting for the bounce at support (which never happened), and by making money off the Covered Call, I was able to reduce my risk and more importantly, my loss. I could have also bought a cheap protective put as well, which is something I may consider for next time I am playing over earnings as that certainly also would have helped offset losses.

This reminds me of my ANDE trade a few weeks ago when the exact same things happened...HUGE breakout right before earnings, only to be CRUSHED by earnings. Maybe this should teach me a pattern is developing here?Tomorrow is another day. I am waiting on the sidelines for now until i am comfortable the shakeout/correction/abberration is over and trends (Bullish or Bearish) are normalizing.

Happy Trading!

Tuesday, February 27, 2007

Another Black Tuesday?

Well Traders, today was BRUTAL. Well, it was brutal for other traders, but not really for me. I had some very solid risk management in place so even though I was taken out of about 70% of my positions, I only realized losses of 0.43%. Not bad at all. My other positions haven't been taken out yet, and in the case of JOYG, the next few days may have presented me the GOLDEN opportunity I have been waiting for.

Speaking of which, I am going to hang out on the sidelines for a day or five and see how this shakes out. If this is a healthy correction, then there will be a TON of buying opportunities for me on some of my previous stocks I follow. I am now the Lion lying in wait for the Gazelle to cross my path. When the time is right, I'll pounce.

If this is the beginning of a Bear Trend, then there are some things to look at...QID for one, which is the Bear ETF for the NASDAQ. Also, DOG, the Bear ETF on the Dow (as in DOGs of the DOW), may be worth a look.

If we do head to a Bear Trend I will be hanging out religiously on Über-Bear Tim Knight's blog, Trader Tim. If you want some awesome Ursine suggestions, that is the place to be! I made some very good $$$ last summer following him and considering he started Prophet.net and just published a book on Technical Analysis, the guy has some props to back up what he writes.

Finally, there was a MAJOR bump in the FEAR factor in the markets as evidenced by the $VIX and $VXN. If you were in positions today and wanted to sell a Covered Call on say Radio Shack (probably the ONLY stock in the Green today), you probably made some SERIOUS jack on selling the call. Options just became more expensive. Sucks if you are buying, GREAT if you are selling!

Happy Trading

Wednesday, February 21, 2007

JOYG - Like I Was Saying...

Well Traders, this was EXACTLY what I was waiting for! Remember yesterday I mentioned I was waiting for JOYG to break above the horizontal resistance line with heavy volume. Ta da! There it is! So, I entered a partial position today, and we'll see what happens tomorrow. If it continues to head up, I'll buy a little more. If it heads back down towards new support, I'll buy even more. Then, I'll wait for a "bounce" off support and fill an entire position in the stock.

You'll notice that I have two other diagonal resistance lines to contend with. Should the stock break the first one, I have a nice $10-$12 potential until the second resistance line. First though, I need to break the first one.

***

VLO is another stock in which I hold a position in. I am mentioning this because it had a MAJOR breakout today. The stock FINALLY broke over its "Double Top" on heavy volume. here is the 3 month chart:You'll notice the stock broke BOTH the horizontal and diagonal resistance lines. Why is that significant? Take a look at the 9 month chart:See what I see? That's right...NOTHING. Nothing until $62.50-$63.00. By that I mean there is no resistance. This stock could make some pretty heavy headway here. Couple that with an AP article in Yahoo Finance about a potential stock buyback by the company of close to 15-20%, which is up from an estimated 5% buyback, an upgrade of the stock price target from $79 to $82 and crude hitting $60 a barrel, and you had the makings of a wonderful day if you own the stock. If VLO sniffs anywhere near $80, this guy will be getting his family some serious Christmas gifts!

***
Keep It Simple!

Sometimes I get pretty involved in searching for the "perfect play" in what amounts to "missing the forest for the trees." INVESTools does a pretty awesome job of finding those "trees" that lead to profits. Here is a picture of Suntech (STP). I have highlighted the "peaks" in green boxes, and the "bottoms" in red boxes. You'll notice that the second "peak" was higher than the previous one, and so was the second "bottom." Technical traders recognize this as potentially being the start of a Bullish trend. When the INVESTools chart fired off 3 "Green Arrows" highlighted in 3 gray circles, that is an "official" entry signal. Here is the chart:
If I had entered this play then, I am supposed to exit when the stock breaks its trend, or fires off three "Red Arrows." Well, according to the INVESTools method, I would still be riding this gravy train of profits.

Happy Trading!

Tuesday, February 20, 2007

New Trades DVN, ZUMZ (JOYG on Deck)

Well Traders, I pulled the trigger on two new trades today, DVN and ZUMZ.

I liked DVN because it is at the bottom of an Ascending Channel which is $12.50 high. Since I am at support, I have low risk on this trade. I will either get stopped out 3% below support OR, if the stock closes below the diagonal support line for two (2) consecutive days, I will get out.

This actually has two possibilities for profits. The first is a Pennant play, which means the stock will hit diagonal resistance and fall, at which point I may get out for a small profit.

Or second, and very exciting, is for the stock to break above diagonal resistance and head for the Channel Resistance which would capture $12-$15 in profits! At that point I may sell the stock and wait for the pullback, or sell an ITM Covered Call and buy it back once the stock retraces back to Channel Support. Here is the chart:ZUMZ which I have been watching for awhile, has made another "bounce" today, so I got in again. This has a modest $4-$5 profit target at which time, I may consider selling a Covered Call. The only concern I had was that there is a "Bearish Divergence" with the MACD meaning those peaks are getting smaller, even though the stock is going up in price. It is just something to be aware of. Anyway, here is the chart:JOYG is a stock that is very high on my radar. This is a GREAT stock fundamentally (8/2, 3.62, 4.0) and looks to be making a run at breaking TWO resistance lines, a horizontal and diagonal one. If it breaks those two on good volume, that would be an entry point. I would play this as a TREND trade, so I would play it through earnings if the signal occurs before that day, then maybe buy a couple of protective Puts just in case. Here is the chart:The BIG ONE that got away...FRK:

I swear to GOD I had this on my BUY list for this morning only to see that Vulcan Materials made an offer to buy them over the weekend. The cost to me...$19!!! Check this out!ONE of these days I'll get this lucky (by the way, "luck is when preparation meets opportunity" - Seneca the Elder").

Happy Trading!

Thursday, February 15, 2007

IEDU and JEC

Well Traders, I invested in the Homefront so to speak and got into some IEDU or INVESTools. I did it for a number of reasons, but primarily due to its bounce recently, and the impressive growth the stock has had over the year. Here is the chart:


JEC
I also played my first Call in a long time on JEC. The reason for a call was taking advantage of a bounce, as well as the anticipated run-up to a 2 for 1 split on 3/15. I got in a March $95 for $1.80, and I expect the stock to reach over $100 based on my supporting trend line. Should everything go as planned, the option should be worth at least $5 when the stock hits the $100 target. That is better than a 3-1 Reward/Risk ratio, which is solid.

I did make a "mistake" possibly. The March $90 had a 4-1 Reward/Risk ratio, but it cost $4.30. My reasoning for taking the $95 was that in case of catastrophy, I would only be out $1.80 on the $95, but $4.30 on the $90. However, as my coach Sam S. pointed out, that based on position sizing (Portfolio Heat), the losses would still be about the same because I would have had a smaller position size on the $90. So note to self, ALWAYS take the better Reward/Risk play. We'll wait and see how this plays out.

You'll notice I have marked my "Time Stop" and my "Target Price" on the chart, and I have my "Hard Stop" set at $0.90 and my "Mental Stop" set at 1% below recent support since in essence this is a short term "swing trade".

One That Got Away

PCAR - Which I mentioned a few days ago took an early bounce just like CLF just did.

Happy Trading.

Tuesday, February 13, 2007

Jumping In EXP and STLD

Well Traders, I pulled the trigger on two trades today, EXP and STLD.

EXP was a trade I have been waiting on and today we got the "bounce" I was looking for. Here is the chart:As you will see on the chart, I am looking for a run-up to resistance at which point I will sell a Covered Call. This is a TREND trade so I hope to be in this for some time. I plan on Selling Covered Calls and capturing (paper) profits on the way up until such a point that either A) the Trend is no longer my friend or 2) I get taken out of a Covered Call.

STLD was another stock I was looking into that seemed to break my way. The chart shows a bounce today and I have estimated the movement of the stock. Here is a chart:By looking further back, you'll see that the stock is near a 52-week split-adjusted high. What this means is, if it breaks above the most recent top, this could go a LONG way. Here's a look back at a longer chart:As you can imagine, I am in this as a TREND trade hoping to see if this can regain its pre-split level of $60. It may take awhile, but again, I'll sell some Covered Calls to pay for my patience and see what becomes of this trade.

One That Got Away - CLF

Darn. Sometimes a waiting Lion gets passed by a quick Gazelle. I have mentioned CLF recently (I have done VERY well with this stock in the past) and today, I got a premature (for me anyway) pop. Take a look:
You'll see it bounced off the Median line which is fine, except for me. I wanted it to head to the bottom of the Ascending Channel, THEN bounce. Today's action made the Reward/Risk undesirable for me, so I will have to wait again for another opportunity to enter this trade. In the meantime, it will remain on my Watch List until the Gazelle feels brave enough to pass by the Lion again.

Happy Trading!

Monday, February 12, 2007

Ideas...

Some of these are a rehash from before, but their patterns may have changes, or they are closer to their trigger points...you be the judge:

BKUNACLF
COG (Earnings warning)
CROX (Earnings warning)
EXP
WMB (Earnings warning)
ZUMZ (Earnings warning)

I have also mentioned "Earnings warning" because of some recent plays that went bad (or great if you were on the other side) due to earnings announcement. You may want to keep these on your Watch List until AFTER earnings.

Happy Trading!

The POWER of Earnings

Well Traders, one thing I am going to stick to from now on, is NOT to play around earnings. Now, this is a pretty good rule because earnings can be a complete crapshoot. A few days ago, I mentioned BW (and ANDE as a Bullish play last week and we know how that turned out) as a possible Bearish play...here is the chart today:You'll notice that on Friday, things were looking really good for this downside play. The stock was making lower highs and lower lows, a Bearish indicator. With earnings coming up, it seemed like it could be more fuel to the fire but low and behold, a WHOPPING turnaround! That is the power of earnings, and is why it is important to me to stay away (unless I am already in a long-term TREND trade). Full disclosure, I did want to get into this trade in a Bearish position, but I wasn't able to...whew! That would have been a very painful lesson.

For now, I am just going to bide my time, be the Lion, and wait for good post-earnings plays to come my way.

I should have some more ideas for trades later.

Happy Trading!
Friday, February 09, 2007

NEWS - The Trade Killer!!

Well Traders, today I was hit with not one, but TWO news items that doomed me. The first was on HANS. You remember yesterday when I got stopped out (I would have closed the trade anyway since it was the second consecutive day below my trend line), well today, GREAT NEWS for HANS! Anheuseur Busch decides they are gonna team up with HANS and distribute the Monster drink wherever AB sells its beer. WHAMMO, the stock skyrockets to over $3 at one point! Just my luck...a day late and a dollar short. Oh well, I traded my plan, and those are the breaks.

Take a look!

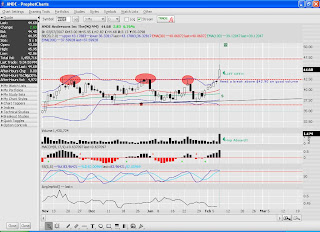
Today on ANDE I got stopped out. Funny, I bought the stock on the breakout on anticipated better than expected earnings released by the company, then earnings comes today (which beat the street estimates) and WHAMMO, the stock plummets over $3!

Take another look!It just wasn't my week, but that is okay. I had my plans set up correctly, cleared them with the hotline coaches and traded my plan. It didn't work out the way I hoped, but the law of averages will catch up to me and the trades I play well will more than compensate the trades that didn't pan out. The losses from each trade was less than 1% of my portfolio so it wasn't a big hit. That's called "managing your risk."

Next week should bring new opportunities to trade and make money. Have a great weekend!

Happy Trading!

Thursday, February 08, 2007

Loss on HANS

Well Traders, sometimes you win, sometimes you lose...or as they say in the market, "Sometimes you eat the Bear, sometimes the Bear eats you."

HANS was a bounce play that I felt could have made a good move, unfortunately it did not go as planned. I was stopped out at my stop loss for less than a 1% loss of my portfolio which is good money management. I would have closed the trade at the end of today even if I didn't get stopped out because the stock would have traded two consecutive days below my trendlines and that is one of my exit rules.

Plenty of things on the horizon to make money on!

Happy Trading!

More Ideas...

Hey Traders, here are some more ideas for your watch lists. I have these stocks on mine waiting for bounces to enter the trades. These are NOT recommendations to buy or sell, but my own ideas on what I am looking to possibly trade in the future. Do your own due dilligence!

BKUNACLF
PCARPG

ZUMZNow these trades may NOT go as planned, but this is their anticipated moves. If they prove to be accurate (or reasonably accurate), there should be some decent profits in there.

What's on your watch lists?

Happy Trading!
ANDE Away We GO!!!

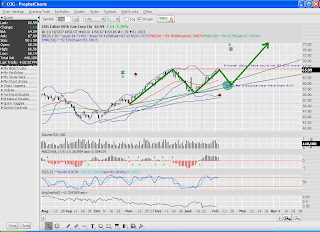
Well Traders, there it is, the breakout that pushed ANDE over its Triple Top. Look at that volume! Looks like the Corn Train is pulling away from the station!! We'll have to see how earnings plays out today which will either help the stock, or hurt it. I actually took a half position on Wednesday in anticipation of today's announcement. Now we have a very strong support area (previous resistance) in which to bounce from. If it comes back to that line, I will wait for the actual bounce before adding to my position. If it starts to run up even further, then I'll add more, though it will be less profitable than the bounce. Time will tell.

EXP

Looks like Eagle Materials is setting up for a nice bounce here. I am being the Lion and laying in wait for this one. I could pull the trigger today or tomorrow if it bounces and let it run up for a nice gain. Here is the chart:Real Estate (IYR)

I was poking around on the Real Estate ETF (IYR) in order to pull out the stocks that comprise it to find that this is a HOT sector. Almost ALL of the stocks are having amazing runs right now so you may want to look in that sector to find some treasures. I will be uploading another ETF, XLE, the Energy Sector one to see what looks good there. It is my goal to have all the sector ETF's in their own Watch Lists so when I see a sector starting to do well, I can jump in on the stocks in that sector. Remember Traders, "A rising tide lifts ALL boats."

Happy Trading

Tuesday, February 06, 2007

"Average True Range" (ATR) Explained

Thanks again to Jeff L. in Seattle for this explanation of the "Average True Range"

***

Is there a Technical Indicator I can use to tell me where I should place my Stop Order?

After you have completed all your analysis to place a trade, now the fun begins. “Where do I place my stop order?” Setting a stop order is mandatory if you are interested in limiting your losses, and you must limit your losses to be a successful trader. In determining where to set a stop order, a few questions to ask yourself are, how much are you willing to lose? Where is support? Where is a safe place I can place a stop that will protect me, yet not take me out on a volatile day? I occasionally hear people say that they wish there was a technical indicator that could be used to take out all the guesswork of where to place a stop. Guess what? There already is an indicator that can be used to facilitate this! The indicator is called an Average True Range, or ATR indicator.

J. Welles Wilder introduced this indicator in 1978. The ATR indicator is used to measure a securities volatility, not price direction or duration. It was originally designed for commodities since it takes daily price data into consideration, but can be used for stocks as well. The ATR is most commonly used at a 14 day time period. To see this indicator, go into the Interactive Chart and select it from the “Select Studies” drop down menu. When you add it to your chart it will give you a current reading relative to your stock. Keep in mind that a $20 stock will have a lower ATR reading than let’s say a $100 stock. The idea is to see what the indicator tells you now, and what your extreme high points and low points are.

Let’s assume your ATR gives you a reading of 2.0, and a high of 3.5. This means that the stock as of now could fluctuate within a $2 price range. Over time if 3.5 is your highest ATR reading, than historically you can see that even at it’s wildest moment, the stock didn’t swing more than $3.50 during heightened points of volatility. So even if I wanted to use an extreme measure, I could set my stop $3.50 below the stock price and this would be a safe enough place to not trigger my order on a volatile day, yet still protect me from a potential breakout to the downside. You will still want to use support and resistance points to tell you if your stock breaks and one of these points, but an ATR indicator is a great way to set a stop order when you are trying to find where even the most volatile points won’t trigger it.

So, how can we use the average true range in calculating our stop loss? All you do is you subtract a multiple of the average true range from the entry price. I might take two times the average true range and subtract it from my entry price. For example, if we had a one dollar stock and its average true range value was five cents, I would simply take a multiple of the average true range, which I said we’ll use two in this example, and we’d subtract it from our entry price. So, two times our average true range is ten cents, subtracted from our entry price gives us a stop loss value of 90 cents.

Now, by adhering to this pre-defined point at which I sell, I know that if the share price doesn’t move in my favored direction, and actually moves against me, I already know the point at which I’m going to sell. My emotions are removed from the equation, and I just simply follow what my stop loss says. This is how most successful traders limit their losses. They know when they’re going to sell and they have this pre-defined before they even begin trading. Although their methods of calculating the
average true range and the stop loss may be different the one common element here is that they have a stop loss in place.
-------------
See also ......

On My Radar

Well Trader, I am being the "Lion" and waiting for some trades to come my way. Remember, these are NOT recommendations to buy or sell, these are just my ideas. I'll let you know what I am looking at right now:

ANDE:

If it breaks through this Quadruple Top, this thing could soar. Here is the chart:COG:

This one you have to wait for. It should come back down to one of the diagonal supports, then BUY (not a recommendation!) on the bounce and let it head back to resistance. If it breaks resistance, then you have an Ascending Triangle pattern play good for some solid money! Here's the chart:
Here is a BEARISH idea...

BWThat's just SOME of the trades I am looking at right now. What's on your radar?!?

Happy Trading!

Monday, February 05, 2007

"Average True Range" (ATR)

Well Traders, I received a nice email from one of my followers that I thought I would share with you. When I created this blog, along with my other one, http://iron-condor.blogspot.com, it was to promote the exchang of ideas. I know well enouigh that I haven't cornered the market on great trading ideas, which is why I love when others offer their own insight. This email came from Jeff L. of Seattle (probably while drinking a double skinny decafe mochachino latte :P ):

Dear Andrew:

Greetings from the Great Northwest, just south of Seattle. I am also an Investools student. I enjoy reading your blog. A couple things I wanted to mention.
First, I totally understand and agree with having a risk management plan. However, your "rule" about 1% below support as a stop loss can be too restrictive. I am sure you are aware of the concept of Average True Range (ATR), and if not, I am sure you will check on it and add it to your tools. A stock must have room to breath within the confines of a trading system's rule, i.e. move within its ATR. I would suggest you look into amending your Excel spreadsheet to allow your stop loss below support to be the greater value of 1% below support OR 105% of the value of a 20 or 30 day moving average of the stock's ATR.

Jeff, thanks for your email and input. Actually, I had never heard of the ATR though I am cognizant of the pitfalls of tight stop-loss placement. I do see this study available on the INVESTools software along with the ability to change the time frame. I am thinking that the number it returns would be a "safe" place to put your stop-loss based on the number? If it returns "1.5" I guess that would signify $1.50 below whatever the Moving Average (20 Day, 30 Day) you used for the study. Maybe yes, maybe no?

I actually place my Stop-Loss at 1% below support on a quick "Swing" trade. That doesn't necessarily mean below my entry, but at support. If I am looking for just the bounce up to the top of the channel, any break below that support would alert me quickly I made the wrong call and to get out.

On longer term "Trend" trades, I set my stop-loss at 3% below support to give a little more "wiggle room" for a longer time frame. I also have a smaller position at risk because my stop-loss will be larger on a Trend trade than a Swing trade. I actually have another "Stop-Loss" monitor that effectively gives me a "trailing stop-loss" based on the stock prices over a number of days. This is usually a lot more conservative and gives greater breathing room to my trades. Since I have several reasons to get out of a trade (profit target, loss, time, trend break, etc.) I try to give myself plenty of signals which forewarn me of danger or status quo.

Every one has their own rules depending on what trading style fits their profile. I wanted to present another idea for others to consider as part of their trading regimine.

Happy Trading!

Saturday, February 03, 2007

Managing Your Risk

Well Traders, probably the most valuable lesson I learned last year and at my recent INVESTools classes is the absolute importance of Managing your Risk. Because trading can be very emotional (and the death knell of ANY trader), it is paramount that you reduce trading down to your fundamental/technical analysis/strategy, and then simple mathematical equations. By doing this, and sticking to your goals, both profitable and not, you are managing your emotions, which help to manage your risk.

Dr. Alexander Elder, who wrote "Come into My Trading Room," a book I highly recommend, establishes his own risk. He will not risk more than two percent (2%) on any one trade, and no more than six percent (6%) at any one time. While I subscribe to his 6% overall risk, I only risk 1% in any one trade. This gives me a minimum of 6 trades I can be in at any one time.

I created a Risk Management Tool on Microsoft EXCEL which enables me to monitor all my postions in different accounts to see where I am with my "at-risk" trades (those exposed to the 1% loss). This helps me manage my risk and exposure. The sheet, shown below, begins with total cash available at the beginning of the month, then that establishes my 1% risk exposure, which is $500 based on this example. I also have four different risk calculators based on what type of trade I am playing. Longer term TREND plays have a greater risk because I allow 3% below support of the stock. Shorter term SWING trades I play tighter with only a 1% risk below support. This enables me to correctly size my position for each trade. Since I only trade in round lots of 100 shares, I always round DOWN. This is more conservative, but managing risk should be conservative in order to be successful. Here is a glimpse of my worksheet:

(Click to enlarge, use your browser's "Back" key to return to the Blog)

You can see that I have six (6) fictional trades (I used real stocks, but made up the prices, they are NOT suggestions to buy or sell). However, due to position sizing, I only have 3.4% at risk at this time, or $2,197.00. You'll notice that just under the dollar amount I have the words "Keep Trading" highlighted in yellow. That is because I have not yet reached my 6% "at-risk" limit. Therefore, I am allowed to continue to trade in this account. It also shows I have only $2,390 left in Cash available to trade.

On the right sie of the sheet are the risk calculators. I have them set up for each account because different accounts may have different cash balances. Each risk management is unique to each account. This is how you try to stay ahead of the game.

Here is another worksheet example:

You'll notice I put a few more trades in there. Now, since my "at-risk" exposure has exceeded 6%, the yellow box below the dollar amount at-risk now reads "Stop Trading." This helps alert you to when your exposure exceeds 6% at any one time. Now here is here is where the fun part begins.

Since I now have a little over 6% at risk, I am NOT allowed to trade any more until one of two things happens. The first, if all these positions get stopped out (which would really suck, but could happen), then I must close them ALL, and wait on the sidelines until that month is over. That prevents "Get Even-itis" which is a gambler/trader sickness. You HATE losing (I do too), so you want to "get even" with the market. That leads to irrational trading behavior and could be devastating to one's portfolio. If you get stopped out of all your positions, then you need a break, like stepping away from the Blackjack table when the dealer is kicking your ass. It is a time to regroup and re-evaluate what you are doing right and wrong. It is an important cool-down period.

The other thing that could happen is better. If any of your positions move to such a point that you can move your Stop-Loss position to a point the trade is profitable, then that trade will move off the "at-risk" position (but not off your worksheet, just change the "Stop-Loss" price to your profitable point), freeing up any more available capital to trade.

This chart needs to be re-started at the beginning of each month. Why? Well, your capital position will more than likely have changed from the preivious month, for better or worse. If you started at $50,000 in January and now begin with $53,000, your "at-risk" capital will rise from $500 to $530. Conversely, if the account dropped from $50,000 to $47,500, your 1% "at-risk" amount would only be $475. This helps you with all your position sizing for the month. Remember, we are not trying to get rich quick here, we are trying to beat the Market, and to do so, you need to be steadfast and prudent when trading. It is okay to be wrong. You'll be wrong more often than you are right. However, by trimming your losses to bare minimums, your winners should overcome your small losers making you profitable in the long run, and that's what we are in for, the long run.

The Risk Management Tool is available to purchase for only five dollars ($5). Believe me, this is money well spent if you are trying to manage your trading accounts. Email me at GSOTrojan@aol.com and I'll give you details on how to purchase the tool.

Happy Trading!